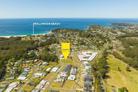
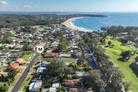
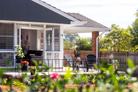
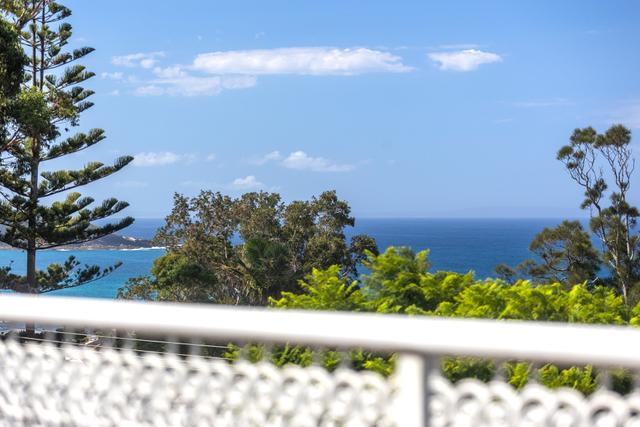
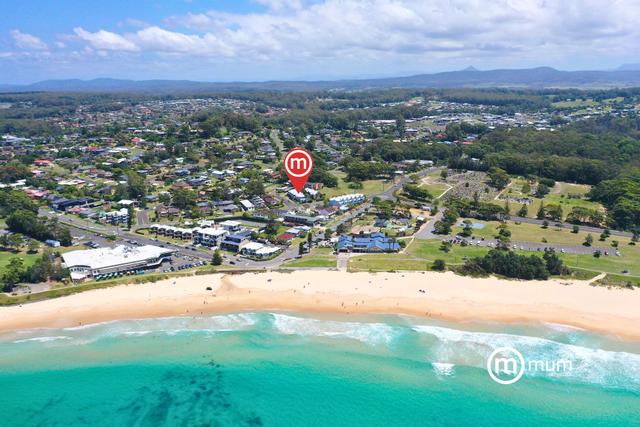
Mollymook
Shoalhaven District, NSW 2539
Median house sale price
$990,000
-5.3% over 12 months
Median unit sale price
$815,500
-5.7% over 12 months
Sales history in Mollymook
View recent sales in Mollymook to get a better understanding of local market trends.
1,265sales records
View:
Price withheld: Some prices may be withheld as requested by the parties involved in the transaction. Click to expand a sale record for additional details.
13 real estate agencies active in Mollymook
Thinking of selling? Compare agencies with experience in Mollymook.
AgenciesAgents
Raine & Horne Mollymook/Milton
84 Princes Highway, Ulladulla, NSW 2539
11
Sold
10
For sale
164
Avg. days advertised
Cooper Coastal Properties
687B Croobyar Road, Milton, NSW 2538
10
Sold
5
For sale
106
Avg. days advertised
McGrath Real Estate Agents Ulladulla
5/119 Princess Hwy, Ulladulla, NSW 2539
4
Sold
7
For sale
82
Avg. days advertised
9
Sold
8
For sale
164
Avg. days advertised

2
Sold
5
For sale
125
Avg. days advertised
1
Sold
5
For sale
374
Avg. days advertised
Mollymook suburb information
A little bit about who lives locally, as provided by government census data.
SummaryMedian sales
Average Age
55 years
Population
1,195
Homes for sale near Mollymook
Find properties currently for sale near Mollymook.
15
Lyn Chambers
18
Chris Coffey & Molly Richards
11
Luke O'Connell
Homes for rent near Mollymook
Find properties currently for rent near Mollymook.
12
Jodie Cliff
13
Bella Coastal Property

Looking to sell your home in Mollymook?
Get a free appraisal from a local expert.
Explore suburbs near Mollymook

Looking to sell your home in Mollymook?
Get a free appraisal from a local expert.
States
Capital Cities
Capital Cities - Rentals
Popular Areas
Allhomes
More

Allhomes acknowledges the Ngunnawal people, traditional custodians of the lands where Allhomes is situated. We wish to acknowledge and respect their continuing culture and the contribution they make to the life of Canberra and the region. We also acknowledge all other First Nations Peoples on whose lands we work.
"With open hearts and minds, together we grow." artwork by David Williams of Gilimbaa.